Cardiovascular Disease Predictor

GitHub Try the Model

An accessible machine learning model for the public

Introduction

Cardiovascular diseases (CVDs), which include heart attack and stroke, account for 19.8 million (32%) deaths globally in 2022 (World Health Organisation 2025).

Well-known risk factors, such as high blood pressure and obesity, are easily identified and monitored by general practitioners during regular health check-ups. Individuals can take preventive measures as advised. They may include reducing or quitting smoking and tobacco use, dietary changes, and stress management. Though a recent study showed that obesity and diabetes had become more prevalent risk factors than smoking (Joseph et al. 2025). Since there is no acute symptom apart from the life-threatening cardiac arrest, people tend to ignore the risk factors of CVDs, which build up gradually. Often, CVDs result from a combination of risk factors, not just a single one. Therefore, one may accuse the pressure from work as the culprit of their high blood pressure while ignoring other factors contributing to the serious medical conditions.

Before people take preventive measures, they need to be aware of their risk of getting CVDs. So they are more motivated to arrange a health check-up. As a result, this project builds an easily accessible webpage for people to learn about CVDs and preliminarily evaluate their risk using a predictive model.

Data Import

A dataset consisting of 72,000 samples and 11 common features was used to build the predictive model.

Feature Description
age
gender
height
weight
ap_hi Systolic blood pressure
ap_lo Diastolic blood pressure
cholesterol 1: normal, 2: above normal, 3: well above normal
gluc 1: normal, 2: above normal, 3: well above normal
smoke Smoking
alco Alcohol intake
active Physical activity

Data Cleaning

Removed samples with extreme weights and heights.

Fixed blood pressure inputs and removed samples with erroneous values.

After preliminary cleaning, 69607 samples remained for model training.

Data Preprocessing

Train-Test Split

Number of samples in training, validation, and testing sets: 41765, 13921, 13921.

Standardisation

using Z-score.

Model Training

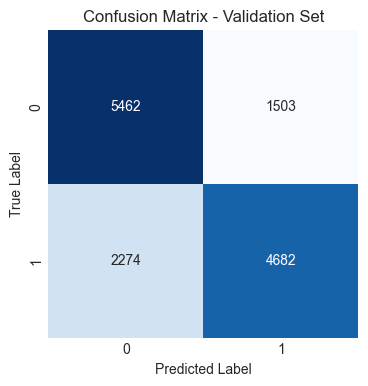
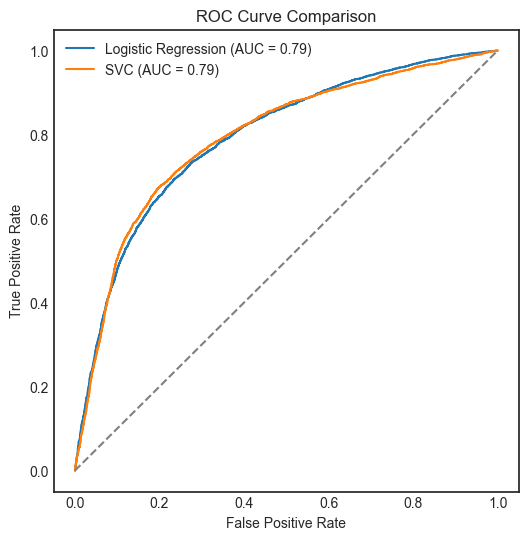
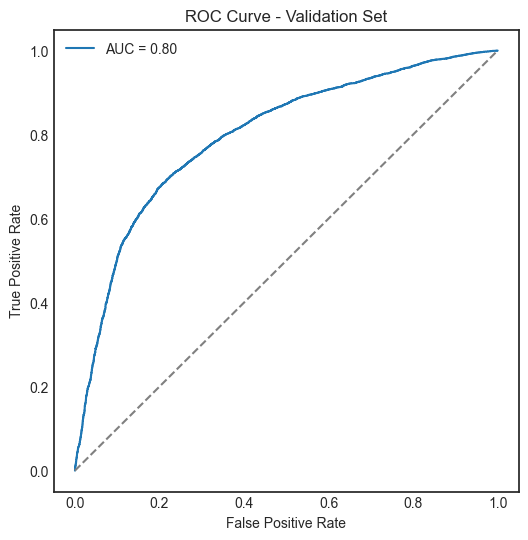
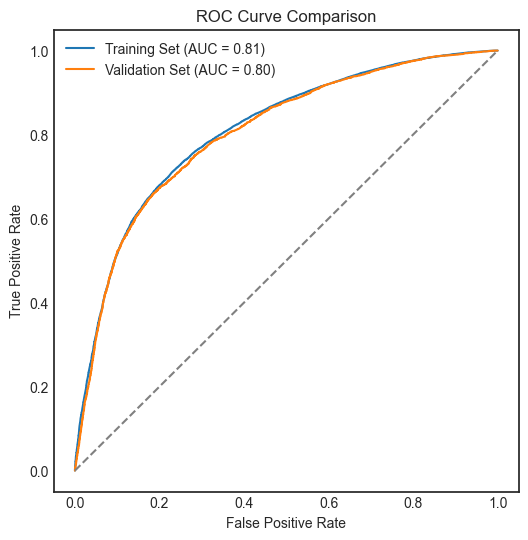
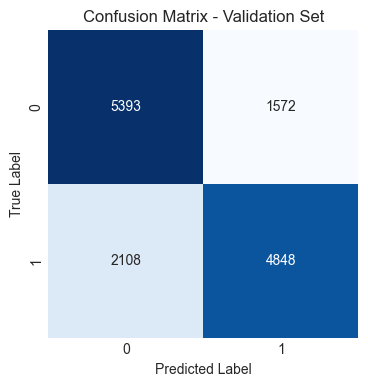
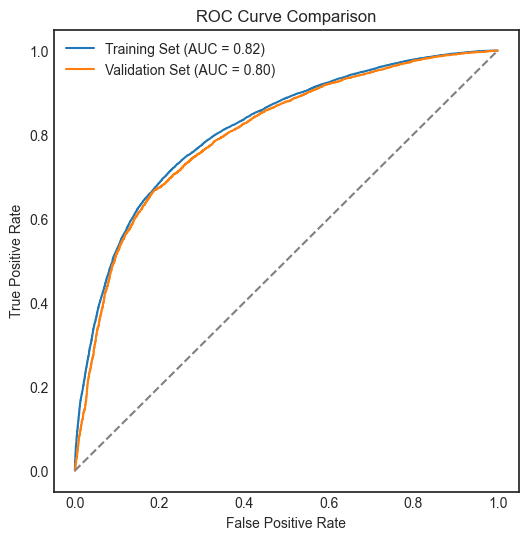
Four machine learning models were trained and evaluated using confusion matrix and ROC curve: Logistic Regression, Support Vector Classifier, Gradient Boosting Classifier, and XGBoost Classifier.

Model parameters: (penalty='l1', solver='saga', max_iter=10000, random_state=42)

Model parameters: (kernel='rbf', C=100, gamma=.01, random_state=42)

Model parameters: (learning_rate=0.1, n_estimators=100, max_leaf_nodes=16, random_state=42)

Model parameters: (objective='binary:logistic', seed=42, subsample=.75, gamma=.5, learning_rate=.05, max_depth=5, random_state=42)

Support Vector Classifier (SVC), Gradient Boosting Classifier, and XGBoost Classifier performed similarly and slightly better than Logistic Regression.

To explore the SVC in action, Principal Component Analysis (PCA) was used for reducing the dimensionality of the feature space into two components to visualise the classification results.

Additionally, a single decision tree was trained to visualise the decision-making process of a tree-based model.

Principal Component Analysis (PCA)

Principal Component Analysis (PCA) is useful to exploit the variance especially in high-dimensional dataset. It is a linear transformation technique that transforms the original features into a new set of uncorrelated features called principal components. The first principal component captures the most variance in the data, while the second captures the second most, and so on. By reducing the dimensionality of the feature space to two components, we can visualise the classification results of the Support Vector Classifier (SVC) in a two-dimensional plot. This allows us to see how well the SVC separates the classes based on the transformed features, providing insights into the model's performance and decision boundaries.

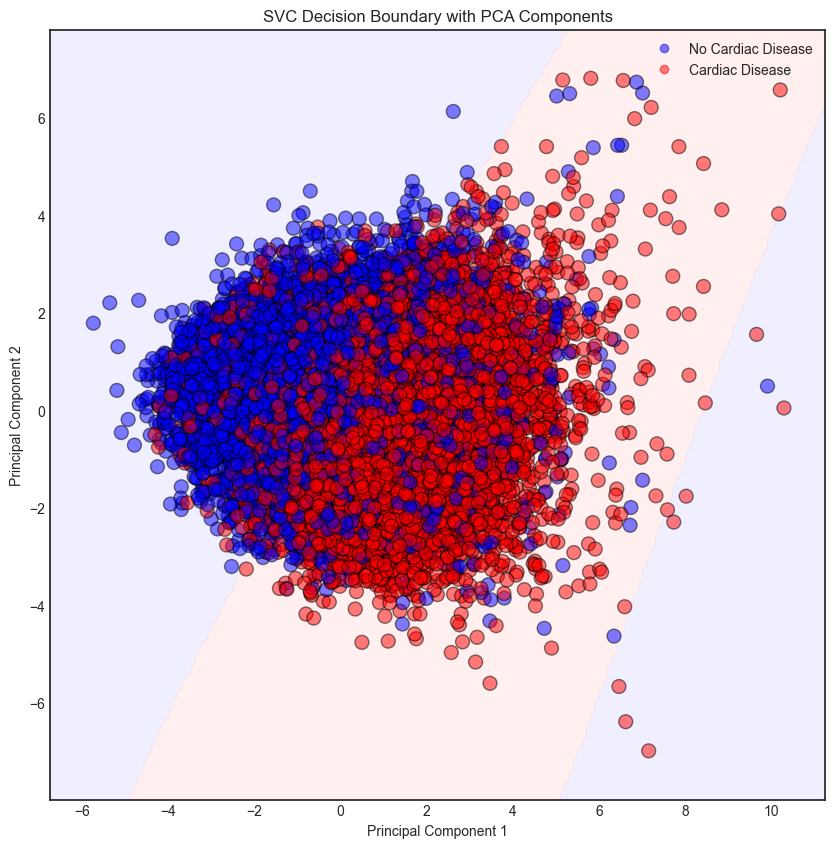
When the feature space is reduced to two dimensions, the decision boundaries of the SVC become more apparent, allowing for a better understanding of how the model makes predictions. In the current model, a default Gaussian kernel was used which measures the similarity between data points in the transformed feature space. As the above classification boundary plot shown, the model managed to correctly classified most of the data points. However, there are apparently many misclassifications. The classification may require higher dimensional feature space for better performance.

Decision-Making Process in a Single-Tree Model

To visualise the decision-making process of a tree-based model, a single decision tree was trained on the dataset. The decision tree is a flowchart-like structure where each internal node represents a feature, each branch represents a decision rule, and each leaf node represents an outcome (class label). By examining the structure of the decision tree, we can understand which features are most important for making predictions and how the model arrives at its decisions. The tree's splits indicate the thresholds for different features that lead to different classifications, providing insights into the relationships between features and the target variable.

The visualisation of the decision tree reveals the decision-making process of the model, which can be manually traced from the root node to the leaf nodes. Each split in the tree represents a decision based on a specific feature and its threshold value.

Model Deployment

The gradient boosting model is deployed as a web application to provide real-time predictions and insights into cardiovascular disease risk. The model receives required input data and generates predictions in probabilities from 0 to 1 of the sample having cardiovascular disease.

As probabilities lie between 0 to 1, a threshold is decided to classify whether the sample has cardiovascular disease. Below is the ROC curve for the best-performing model, where the trade-off between sensitivity and specificity is visualised.

A classification threshold of 0.37 was selected for the final model to prioritise the identification of individuals at risk of cardiovascular disease. At this threshold, the model achieved a sensitivity of 81.4% (95% CI: 80.5%–82.3%), meaning that approximately 81 out of every 100 individuals with cardiovascular disease were correctly identified. This lower threshold increases sensitivity at the expense of a higher number of false-positive predictions. Consequently, samples with a predicted probability greater than or equal to 0.37 are classified as being at risk of cardiovascular disease.

Note that this model is not clinically validated. The result should be interpreted alongside other clinical indicators.

Try the Model